You may sometimes need to be able to do some quick analysis on a list of
voters. Using Counts and Crosstabs allows a user to break down the list
population by different demographics and voting histories.
1. Open a list.
2, In the icon menu of options, click on the icon Counts.

3. A popup menu will appear. Use the default option of Run Quick Counts and
Crosstabs.
4. Select Next.
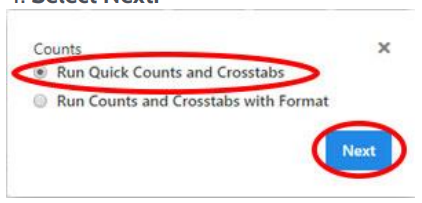
This will take you to the main Counts and Crosstabs screen. On this screen
there are three major sections:
a. Crosstab Section – This is the primary metric that allows you to
group your list population. The results from crosstab selections will
appear on the top of the results.
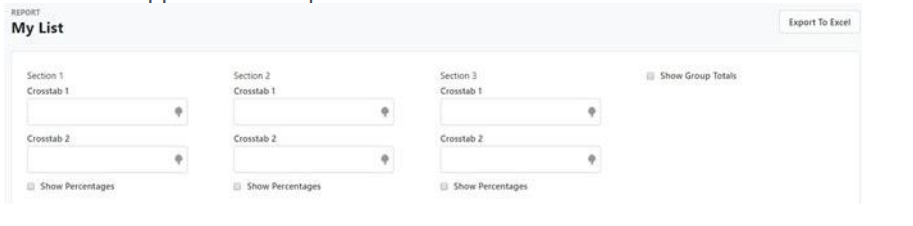
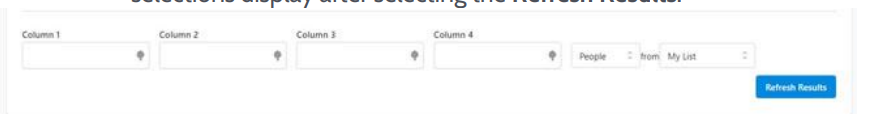
b. Column Section – This is an area where you can further break down
your population list by additional sections. These will appear as rows
with names going down the left side of the list.
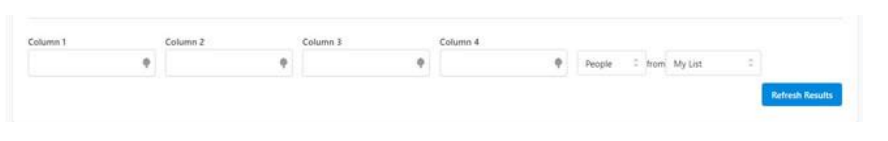
c. Results Section – This is the area where the results of your
selections display after selecting the Refresh Results.
This tool can be very flexible and provide many different views into your voter
population. To help you understand this better, we will go through two examples
to show you how this works.
Example 1: Break a list down by Demographics.
a. In the Section 1/Crosstab 1 box, click on the empty box to bring up
the list of potential values.
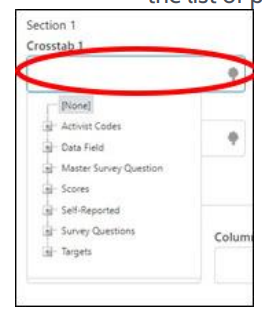
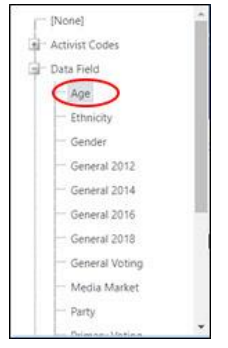
b. Click the + symbol to the left of Data Field to bring up additional
options.

c. Click Age.
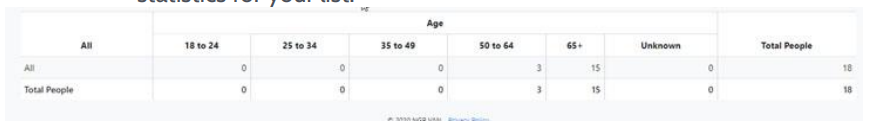
d. Click Refresh Results. The Results section will now display the age
statistics for your list.
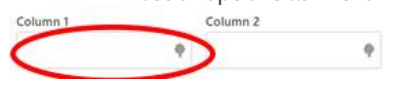
e. Click on the empty box labeled Column 1. This brings up the same
list of options as in the Crosstabs section.
f. Click the + symbol to the left of Data Field to bring up additional
options.
g. Select Gender.
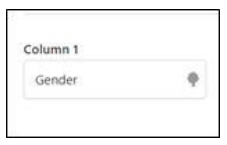
h. Click Refresh Results. The results section now shows your list
numbers broken down by both age and gender.
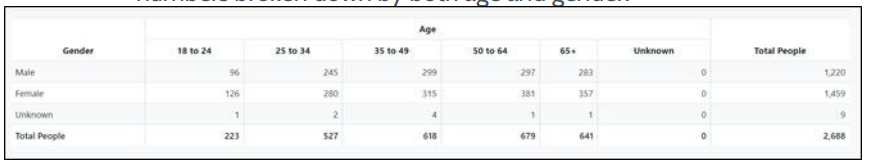
This example can help you answer key questions about your list like:
What gender is most represented in my list?
Does my list represent a younger or older population?
Which combination of age and gender are the most
prevalent in my list?
Example 2: Break a list down by Voting Data.
a. In Section 1/Crosstab 1, click on the empty box to bring up the list
of potential values.
b. Click the + symbol to the left of the “Data Field” item to bring up
additional options.
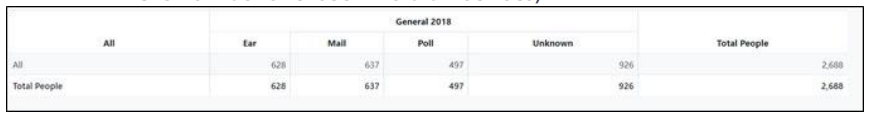
c. Select General 2018.
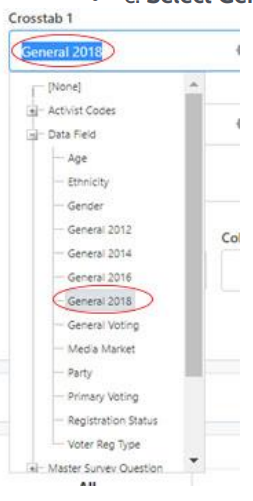
d. Click Refresh Results. The results section will display a breakdown
of your list grouped by the voting method of those on your list (and
the number of those who did not vote).
e. Click on the empty box labeled Column 1.
f. Click the + symbol to the left of the Data Field.
g. Select a second data item such as Age, Gender or Party.
h. Click Refresh Results. The results section will now display the
breakdown of your list by both criteria
Using Voting History of the voters on your list can help you identify
some key details like:
- What party voted more in the 2018 General Election,
Democrats or Republicans? - Does your list contain more voters that like to vote by mail
or early vote? - What methods of voting would you want to target to ensure more NPA or Democrats turnout in future elections?